Population movement in Prague in 2019
March 20, 2020
Population movement in the capital m Prague in 2019
Hl. m Prague was in 2019 po Central Bohemian Region the second most populous region in the Czech Republic. According to preliminary results, the number of inhabitants in Prague increased by 15,645 to a total of 1,324,277. The increase in population was mainly due to an increase in migration (+12,890 people), with 2,755 people added in natural currency. The number of marriages, immigrants, emigrants, the increase in migration and the overall increase increased slightly year-on-year. On the contrary, the year-on-year decrease was recorded in the number of divorces, live births, deaths and natural increase.
As of December 31, 2019, they lived in Prague according to a preliminary statistical balance 1 324 277 inhabitants, of which 51.1% were women. During 2019 the population of Prague increased by 15,645 people, which was 10.8% more than in the previous year. The increase in population increased when the number increased by 9,277, while 6,368 women came. The increase in population during 2019 occurred in 10 of the 14 regions of the Czech Republic. Prague recorded the second highest increase in absolute terms, in terms of per thousand inhabitants, the extent of all regions was even the largest. The population increased the most in Central Bohemian Region (by 15,809 inhabitants) and after the capital m Prague v Pilsen Region (by 5,227 inhabitants).
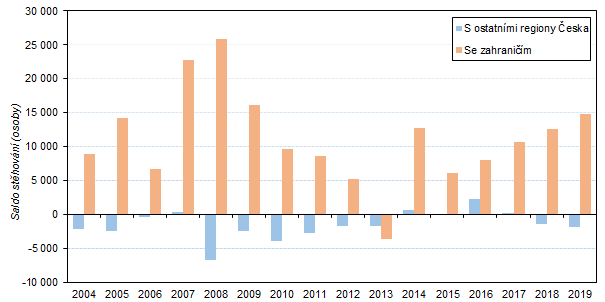
The total population growth of Prague in 2019 was ensured mainly by migration, thanks to which 12,890 inhabitants came to the region (year – on – year increase of 16.4%). Only migration from abroad is required to increase in addition, from which 14,827 more people moved to Prague than moved out. On the other hand, Czech Prague lost its population by moving with other regions (-1,937 people), which was a loss of 479 people higher than in 2018. In 2019, a total of 42,328 people moved to Prague, which was 4.5% more than in the same period last year. There were 29,438 emigrants from Prague, which was only 11 more than in the previous year (ie in relative terms without change).
Figure 1: Natural, migratory and total increase in hl. m Prague in the years 2004 to 2019
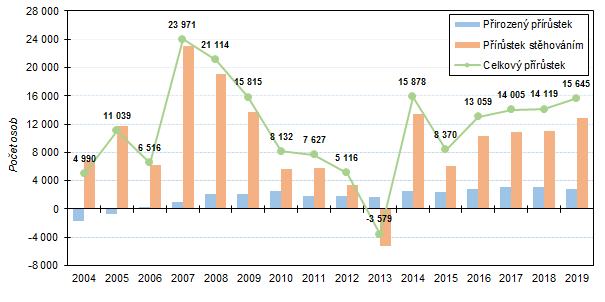
Natural currency In 2019, the population increased by 2,755 people, compared to 2018, the natural increase decreased by 9.5%. The number of live births decreases more (by 3.4%) than the number of deaths (a decrease of 1.9%). During 2019, 14,933 children were born and a total of 12,178 people died. The predominance of the number of births over the number of deaths was first observed in Prague in 2006 and since then – in contrast to the situation in the Czech Republic as a whole – this situation still persists.
In relative terms of the individual components of population movement (ie per thousand inhabitants), Prague ranked among the leading regions of the republic in 2019. Per thousand inhabitants, Prague showed the highest number of live births (11.4 ‰), the lowest number of deaths (9.3 ‰), and thus the highest natural increase (2.1 ‰), the highest number of immigrants (32.2 ‰) and emigrants (22.4 ‰) and the highest total increase (11.9 ‰). Furthermore, Prague showed the second highest migration increase (9.8 ‰), right after Central Bohemian Region.
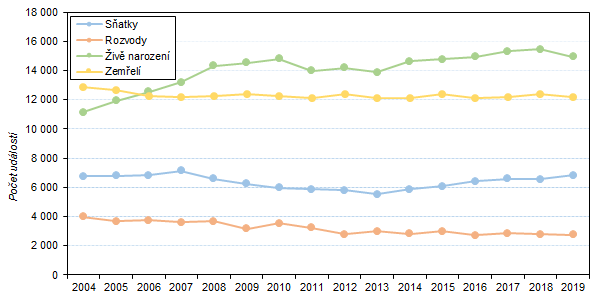
Number of marriages in Prague in 2019 was 6,841 and compared to the same period of the previous year there was an increase of 4.5%. The number of marriages per thousand inhabitants reached the value of 5.2 and was thus the fourth highest among all regions of the Czech Republic. Number of divorces reached the value of 2,743 in 2019. In comparison with other regions of the Czech Republic, the number of divorces per thousand inhabitants in Prague was the second lowest (2.1 ‰).
Figure 2: Balance of migration with other regions of the Czech Republic and abroad in the capital m Prague in the years 2004 to 2019
Proportion of children born out of wedlock in Prague remains only slightly at 40.3% (in 2018 it was 40.7%), still below the Czech average (48.2%). This was the lowest value among the regions. Of the total number of 14,933 live births, first-born children accounted for 52.4%, second-born children for 37.2% and third- and higher-ranking children accounted for 10.4% of all live-born children.
Figure 3: Marriages, divorces, live births and deaths in the capital m Prague in the years 2004 to 2019
Most populated city district As of 31 December 2019, Prague 4 had a population of 132,068. The city districts with the highest population also included Prague 10 (110,571 inhabitants), Prague 6 (107,213 inhabitants), Prague 8 (106,218 inhabitants) and Prague 5 (88,225 inhabitants).
The city district with the lowest population as of 31 December 2019 was Prague-Nedvězí with 333 persons, followed by Prague-Královice (407 persons), Prague-Přední Kopanina (693 inhabitants), Prague-Benice (704 persons) and Prague-Lochkov 828 resident).
Out of the total number of 57 city districts, a total increase in the population of 52 city districts was recorded in 2019. The largest number of inhabitants in 2019 was in the city districts of Prague 5 (+1,793 inhabitants), Prague 6 (+1,591 inhabitants), Prague 9 (+1,427 inhabitants), Prague 4 (+1,167 inhabitants) and Prague 12 (+,816 resident). The total decrease in population in 2019 was reported by the city districts of Prague 11 (-228 inhabitants), Prague 17 (-133 inhabitants), Prague-Petrovice (-43 inhabitants), Prague-Královice (-7 inhabitants) and Prague-Benice (-2 resident).
Relatively, ie in terms of the number of inhabitants of the given city district, the number of inhabitants in the Prague-Březiněves district (+ 85.6 ‰), Prague-Řeporyje (+ 74.9 ‰), Prague-Klánovice (+ 54.4 ‰) increased , Prague-Dolní Měcholupy (+51.7 ‰) and Prague-Nedvězí (+46.1 ‰).
On the contrary, the number of inhabitants in the city districts of Prague-Královice (-17.1 ‰), Prague-Petrovice (-7.1 ‰), Prague 17 (-5.5 ‰), Prague 11 (-2.9 ‰) decreased the most. ) and Prague-Benice (-2.8 ‰).
During 2019, the number of immigrants was higher than the number of emigrants in most city districts, and the migration increase was negative in 5 city districts. The inhabitants of Prague 6 (1,489 people), Prague 5 (1,450 people), Prague 4 (1,313 people), Prague 9 (1,183 people) and Prague 10 (732 people) gained the most migrants. On the other hand, the highest migration decreases were recorded in the city districts of Prague 11 (-225 inhabitants), Prague 17 (-186 inhabitants), Prague-Petrovice (-79 inhabitants), Prague-Benice (-9 inhabitants) and Prague-Královice (-5 inhabitants).
In 48 city districts of Prague, the number of live births in 2019 was higher than the number of deaths, and in 9 city districts the natural increase was negative. The highest natural increase was recorded in Prague 13 (397 inhabitants), Prague 5 (343 inhabitants), Prague 7 (266 inhabitants), Prague 9 (244 inhabitants) and Prague 3 (169 inhabitants). On the contrary, the highest natural decrease was recorded in Prague 4 (-146 inhabitants), Prague 10 (-116 inhabitants), Prague 8 (-80 inhabitants), Prague-Nebušice (-6 inhabitants) and Prague-Ďáblice (-4 inhabitants).
————————————————– ————————————————– —————————–
Methodological note:
All processed data relate to residents who have in the territory of the capital. m of Prague permanent residence, regardless of citizenship. Since 2001 (following the 2001 Census of Population, Housing and Dwellings), the data also include foreigners with visas for more than 90 days (according to Act No. 326/1999 Coll., On the residence of foreigners), as well as foreigners with granted asylum (according to Act No. 325/1999 Coll., on asylum). Since 1 May 2004, in connection with the so-called Euro Amendment to Act No. 326/1999 Coll., On the Residence of Foreigners, the data relate to EU citizens with temporary residence in the capital. m of Prague and long-term residents of third countries. The data also take into account events (marriages, births, deaths) of citizens with permanent residence in the capital. m of Prague, which occurred abroad.
Data on abortions are preliminary, the CZSO takes over data from the Institute of Health Information and Statistics of the Czech Republic.
All data for 2019 are preliminary.
See the publications for more information Status and movement of the population in the Czech Republic – year 2019
Contact:
Mgr. Martin Slavíček
The CZSO Regional Administration Information Services Department in the capital m Prague
Tel: 274 054 223
Email: [email protected]