Mapping the fragmentation of the political Netherlands
Summary of the article
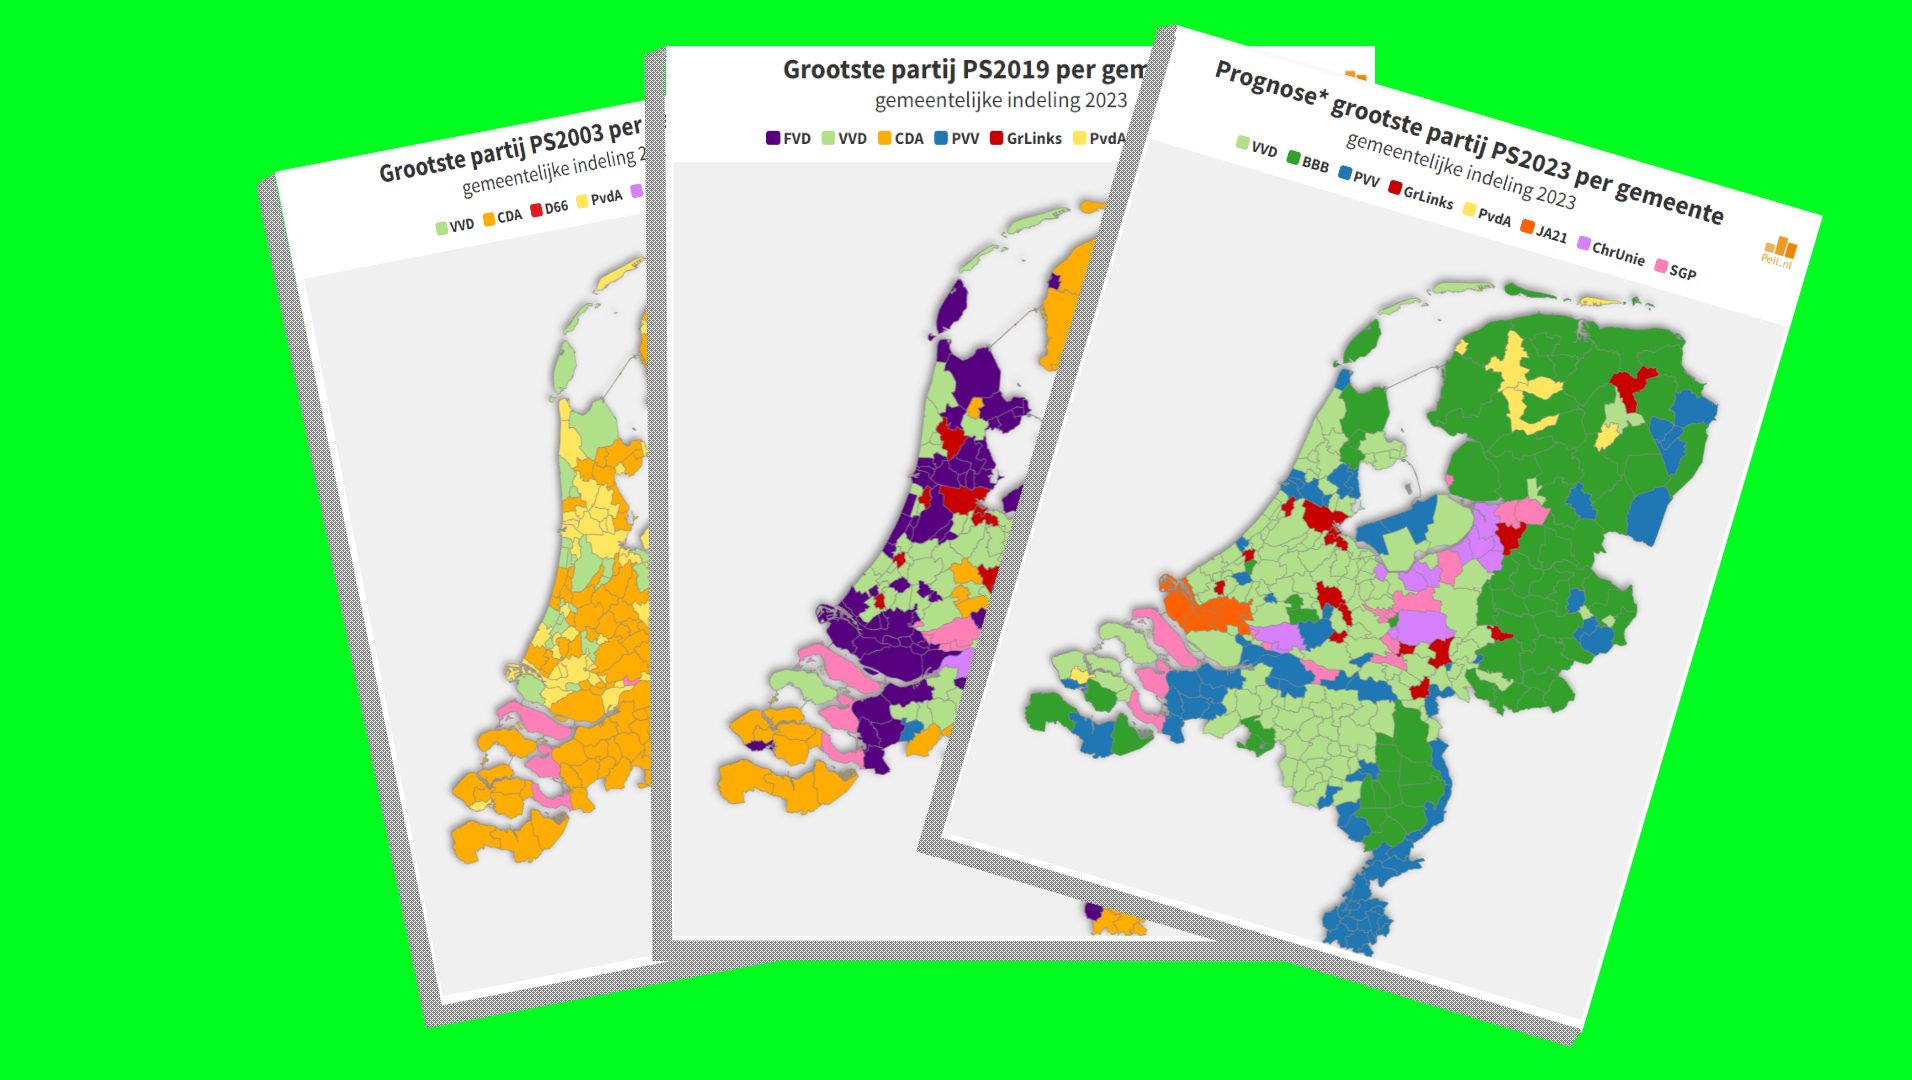
The map of the largest party per municipality between 2003 and 2023 clearly shows how the political fragmentation of the Netherlands is unfolding. The result of PS2023 will be further proof of that.
Read the full article: Mapping the fragmentation of Dutch politics
reading time: 4 minutes
March 15, 2023
With less than 2 months to go before the provincial elections will take place, it is becoming increasingly clear that we are delivering a result that will further confirm the fragmentation of the political Netherlands. The composition of the new Senate, which will be elected from the Provincial Council in May 2023, will make it even more difficult to obtain majorities. The government parties currently have 32 of the 75 seats in the Senate. That seems to be dropping below 30, mainly because the CDA is now in a bad position compared to March 2019, when this party still had 11% of the voters behind it. A halving of the expectation is in line with expectations.
A question relevant to politics in The Hague will be whether the PvdA-GroenLinks combination will win enough seats in the Senate to help the four government parties achieve a majority. In 2019, both parties together still achieved more than 19%, but 2 years later in the parliamentary elections that had fallen to less than 11%. These two parties now stand together at Peil.nl at 15%.
The further fragmentation can be clearly visualized via a number of maps of the Netherlands. To be able to see those patterns properly, I made maps, always based on the current number of municipalities. There are currently 342 in the Netherlands. On average, over the past 20 years, more than 7 municipalities per year have disappeared due to municipal reorganisations. Where municipalities have been collected in those 20 years, the results have been added together to make it easier to compare over time.
When we didn’t have large parties yet
In the last century, the PvdA and the CDA (of its three predecessors) usually received more than 60% of the vote. In many of the municipalities, the PvdA of the CDA was the largest party. In the provincial elections of 2003, the two parties together obtained 52%. The third party, the VVD, achieved 18%. This map shows how these three parties were the largest in all municipalities.
The CDA was the largest party in most municipalities, followed by the PvdA. The VVD was the largest in some twenty municipalities. The SGP was the largest in six municipalities and the ChristenUnie in two municipalities (Bunschoten and Urk). D66 became the largest in one municipality (Gennep).
The 2019 provincial elections
In this century, we saw in most elections that the largest parties no longer achieved the scores of the PvdA of the CDA in the previous century. The only exception was the 2012 elections for the House of Representatives where, due to the all-encompassing between Rutte and Samsom, the VVD and PvdA each won around 25%. But after the VVD and the PvdA formed a government together, the PvdA collapsed electorally. In the 2021 parliamentary elections, the PvdA only received 6% of the vote.
The 2019 provincial elections were special because for the first time a party other than the CDA, PvdA or VVD became the largest. FVD reached almost 15% and thus became slightly larger than the VVD. Because no party was really electorally dominant, the map of the largest party per municipality in 2019 is a much larger patchwork than the one from 2003.
 FVD, VVD and CDA are the parties that know most of the municipalities where they became the largest. We see seven other parties on the map. GroenLinks, especially in student cities, the PvdA in only a few cities in the Northeast, the PVV in a few municipalities in the South, the SP in three municipalities, and ChristenUnie and SGP in a diagonal band from southwest to northeast”).
The possible map of PS2023
Of course we do not yet know the results of the elections of March 15. But it is certain that the map probably gives as fragmented a picture as in 2019. Although it will partly concern other parties. Because ten facts from four years ago, FVD and CDA have fallen sharply and BBB and JA21 have risen strongly.
We have developed a model in which, based on the national poll of Peil.nl, the transitions between the parties in our poll and the historical data per municipality, we can estimate which party will become the largest per municipality on 15 March. . (This model, with some data, has also been used by us during the expected evenings we provided over the last few elections via the Internet and Salto).
It should of course be noted that shifts in political preference may still occur in the meantime for two months and in many municipalities the differences between the leading parties are limited. This is the result of the calculation based on the poll of mid-January 2023.

Compared to 2003, the differences are huge. CDA no longer seems to be the largest in any municipality and the PvdA in only a small number. The VVD becomes the largest party in the largest number of municipalities. Closely followed by the BBB. We also see the PVV in many municipalities, but more spread across the country. JA21 is doing well in the region around Rotterdam. We see GroenLinks as the largest in most municipalities, where that party also became the largest in 2019. in the end, the band of SGP and ChristenUnie can be seen diagonally across the country again. Only in the east of the country no longer. BBB and PVV predominate there.
More than in 2019, the map shows the major difference between the Randstad on the one hand and the North, East and Southeast on the other.
Shortly before the election, we will meet the current map, based on the polls at the time.
This website works thanks to the financial support of the visitors and has no paywall or advertisement. Click here if you want to make a (small) donation. Our thanks are great.