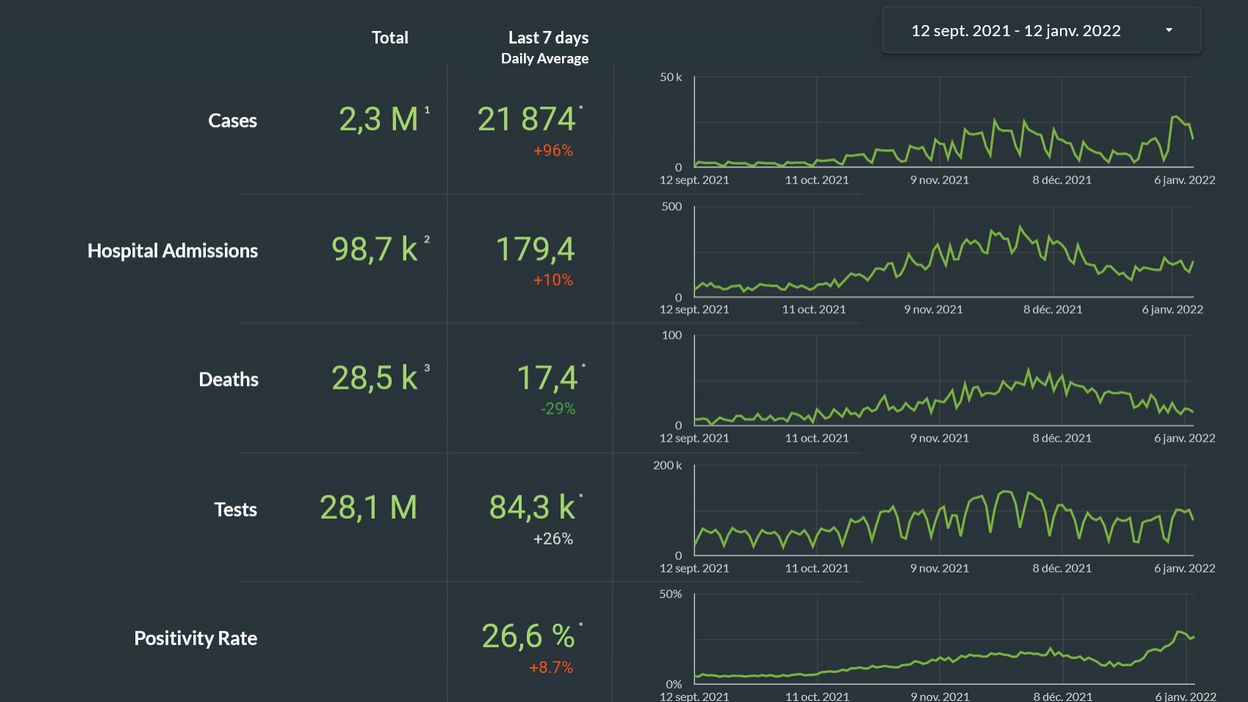
the admissions curve is clearly distanced from that of contaminations
The figures for the coronavirus epidemic in Belgium are rather reassuring on Wednesday: despite contamination figures which continue to explode, the average admissions absolutely does not follow the same movement, on the contrary, it has even been decreasing over the last two days. , as shown in this graph.
The figures revealed this morning, and which mainly concern hospital admissions on Monday, indeed announce a decrease compared to the same day of the previous week, for the second consecutive day. This is what brings down the figure for this over 7 days.
If we compare the figures of the past week compared to the full week, there remains a slight increase, but the rate of which is decreasing (+ 10% against + 22% a few days ago), and especially without any measure with the increase contamination (+ 99%).
Clues thus continue to accumulate, in Belgium and elsewhere in the world, of a less serious Omicron severity: the Brussels Minister of Health has thus revealed that there had not been the slightest patient infected with Omicron in intensive care in Brussels.
Intensive care which also continues to show an overall trend of less occupation (-11% compared to the previous week). The number of deaths also continues to decline significantly (-29% per week).
The consolidated figures of the Sciensano table
Note: these figures are taken from updated data published by Sciensano in open data and put in table form here.
Cases detected¹ : between 02/01 and 08/01, 21874 new coronavirus infections were detected on average every day. This is an increase of 96% from the previous week.
Testing : between 02/01 and 08/01, an average of 84,300 tests were performed daily, a total up 26% from the previous week.
Admissions : they amount on average to 179.4 between 05/01 and 11/01. This is an increase of 10% from the previous week.
Hospitalized people² : 1995 patients are currently hospitalized in connection with Covid-19, including 450 patients treated in care is intensifying.
Positivity rate³ : based on the results of the tests obtained between 02/01 and 08/01, it is 26.6%, up 8.7% from last week.
Reproduction rate : calculated on the basis of the evolution of admissions, the Rt of the coronavirus is now established at 1.04. When it is greater than 1, it means that the transmission of the virus is accelerating.
Death : between 02/01 and 08/01, 17.4 people died on average from the virus. Since the start of the epidemic, 28,539 people have died from the coronavirus.
►►► To read also: Phase 3, phase 4: the battle plan (which we hope is useless) of the hospitals against Omicron
¹ The cases detected are the number of patients for a positive test to confirm the presence of the virus. The date that is considered is the date of the diagnosis, not the test result. Data is considered consolidated after 4 days. The number of cases may depend in part on the testing strategy: if we test more systematically, we also detect more cases.
² In hospitalized patients are counted patients already hospitalized for another reason, and have performed a positive test.
³ The positivity rate is the number of tests compared to the number of positive tests carried out. The same person can be tested several times. It also depends on the testing strategy: if we do not test enough, the positivity rate will be higher.


:focal(545x371.5:555x361.5):watermark(cloudfront-eu-central-1.images.arcpublishing.com/ipmgroup/UFVD77VYQZHRHBUO5OR7E7I6TY.png,0,-0,0,100)/cloudfront-eu-central-1.images.arcpublishing.com/ipmgroup/IMUON7UKXRG7PJ4TKOYT2U7AXM.jpg)