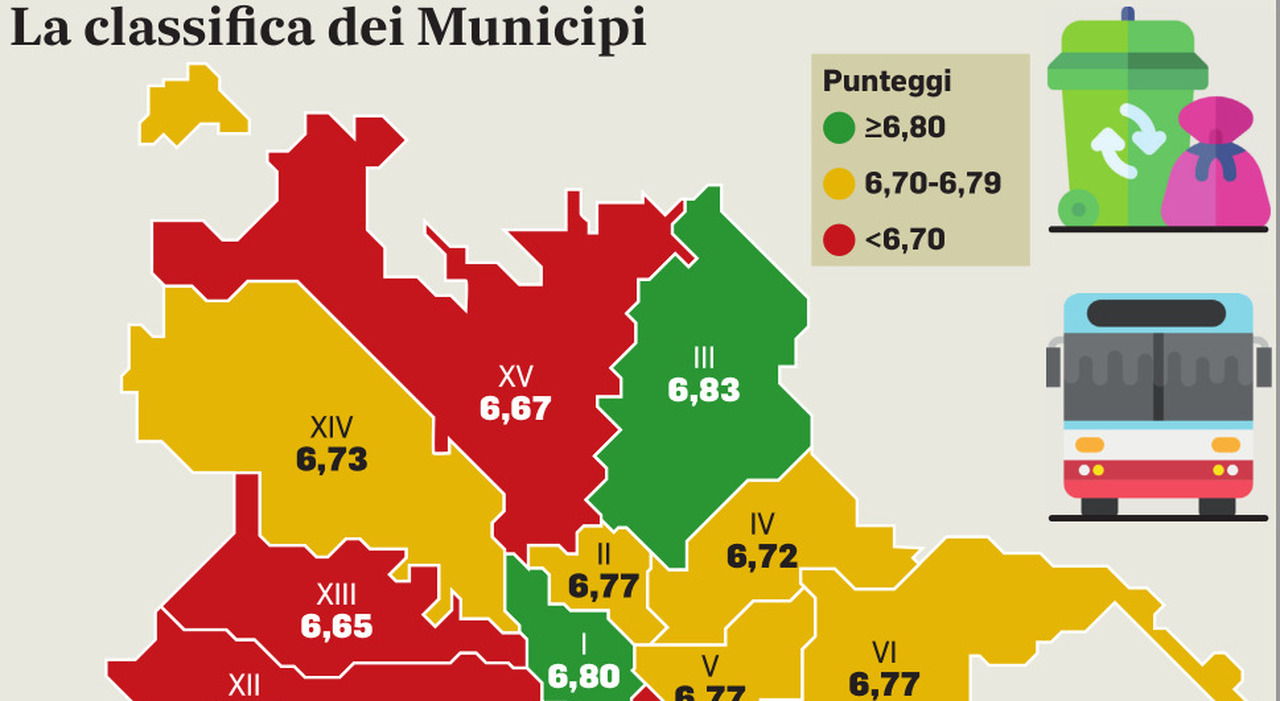
that’s where you live best. San Giovanni-Tuscolano last in the standings
From the historic center to Ostia, from Portuense to Montesacro, the Romans give their marks to the quality of life in Rome and in their municipalities of residence and to the public services provided by the Municipality. And the picture that emerges, in the dedicated section of the annual report of the Agency for the Control of Local Public Services of the Municipality (Acos), is that of a quality of life in the entire city above sufficiency. Not everything is sparkling obviously, but a little cautious optimism seems to be returning. Nella is a place, the lowest grade 6.6, released in the VII Cinecittà, XII Monte Verde, XIII Aurelio and XV Municipio Ponte Milvio, the others oscillate from a 6.7 (II Parioli, IV Tiburtino, V Prenestino, VI Torri , IX Eur and XIV Monte Mario) and a 6.8 in the others (I Centro Storico, III Montesacro, X Ostia and XI Portuense). The average for the entire city reaches 6.7, against 5.3 in 2019.
i DATA
This is the main data that emerges from the annual report which also has another level of data analysis, that for the concentric areas of the city: in the area of the Railway Ring the average grade is 6.7; in the Green Belt sale at 6.72; in the Periphery inside the Junction there is still 6.76 sales; it drops to 6.72 in the periphery outside the junction and reaches its maximum, 6.84, in the coast (Ostia and Acilia).
The composition of the votes also varies: in fact there is an increase in those who define themselves very satisfied (votes from 8 to 10) and quite satisfied (votes from 6 to 7) and a sufficient increase in those who declare themselves not very satisfied (photos from 4 to 5) and not at all satisfied (grade from 1 to 3). In practice, there is a general shift in the degree of satisfaction with the quality of life upwards.
To understand the comparison, in the last pre-pandemic year (2019) of the five-year period of Virginia Raggi and the 5Stelle in the city government, all fifteen municipalities expressed negative votes, recording an average citizen vote of 5.3.
Second step: the quality of life that the interviewees attributed to the Municipality of residence: here the average rating is slightly lower than that expressed for the entire city but we are always well above the sufficiency with an average of 6.48, slightly more 0.2 less than 6.7 expressed in Rome as a whole city.
THE TREND
Acos writes: «Compared to the past, when the quality of life in one’s area was evaluated consistently better than that of the city in general, the evaluation gap first decreased, until the trend was reversed in 2020; this recent trend can be interpreted precisely from the point of view of the identity of the city, especially as it is associated with a generalized and continuous increase in satisfaction ».
Last step: the vote expressed for the various services provided by the Municipality. As in the general analysis, the disaster is given by the vote on the sector of urban hygiene, street cleaning and waste collection. The average for the entire city is 4.9 for both of these two items. The negative points for the cleaning of the streets are 4.6 in the XIII and 4.7 in the Historic Center, in the VIII and in the XI Municipio. The best grade comes from the VII with a “flattering” 5.1.
The best performance is recorded by the municipal pharmacies which pass a 7.3 rating on the average of the entire city and with the most expressed vote, a 7 round from the XIII Municipality, and with the highest rating, 7.4, given by the residents in Municipalities II, IV, IX, XI, XII and XIV.
Bills, from heating to the two-rate tariff: 5 things to ask the administrator to save in the condominium (and not argue with the neighbors)