
What is a regular salary in Norway?
Statistics Norway publishes wage statistics every year. Here you can check the salary level in over 400 different professions. However, there are many who do not recognize themselves in the figures, especially when it comes to average wages. The average salary is usually not the best indicator of what a «regular salary» is either.
Almost no one has a salary that is exactly on average. In addition, more than 60 per cent of wage earners have lower wages than the average. This is because a few wage earners with very high wages are raising the average.
When we examine the distribution of wages in the population, we can distribute all wage earners from the lowest to the highest wage. Then it looks like in the figure below. Most are located in the area around the top to the grave line. The few who have very high salaries are on the right in the figure.
Figure 1. Distribution of monthly salary per full-time equivalent. Percent
The figure shows the wage distribution in Norway. The average monthly salary is higher than the median monthly salary. This is because the wage distribution is skewed.
Source: Wages, Statistics Norway.
We find the average salary by summing all employees, and dividing by the number of employees. Average
monthly salary
per
full-time equivalent
in 2021 var 50,790 kroner. Multiplied by 12, it gives an annual salary of approximately 610,000 kroner.
Many will find that the average seems high. The same applies when we look at the average salary within each individual year. Therefore, it may not be appropriate to compare the average salary with the salary of individuals. Instead, it may be wise to look at more statistical measures to get a better picture of the wage level – both in general and within given occupations.
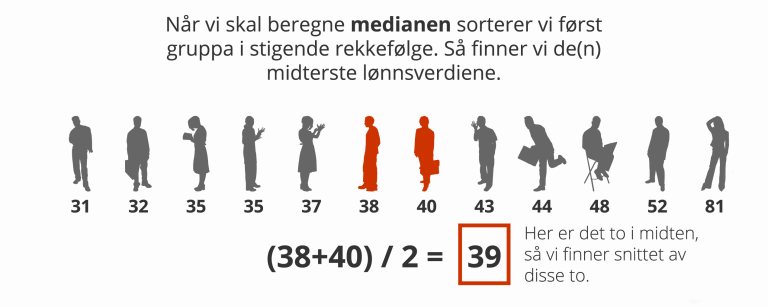
The median can give a better picture
Median salary is a goal that many people often recognize themselves in. The median salary is not affected in the same way by the very high salaries at one end of the distribution, and is therefore typically lower than the average salary.
When we divide all wages from lowest to highest, the median earner is right in the middle. Half of the salaries are on one side of the median, and the other half on the other side.
In 2021, the median monthly salary was 45,830 kroner per full-time equivalent. It is almost 5,000 kroner lower than the average salary. Multiplied by 12, it gives an annual salary of approximately 550,000 kroner.
Here you can see both the median and average monthly salary for all the professions Statistics Norway has statistics for.
Big difference from profession to profession
The more people who have very high salaries compared to the “normal” in a given profession, the more the average will deviate from the median. A good example is a comparison between radiographers and financial brokers.
Table 1. Monthly salary. Median and average for radiographers and financial brokers. 2021. Kroner
| Median | Average | |
|---|---|---|
| 3211 Radiographers etc. | 47 890 | 47 850 |
| 3311 Financial Brokers | 74 540 | 104 330 |
Among radiographers, there is little spread in salaries, and the median and average salaries are almost exactly the same. Among financial brokers, on the other hand, there is a very large spread. There are a few with very high salaries who raise the average salary, and the distance between the median and the average is therefore large.
Different goals – all are “common”
To get an even more detailed picture of the wage level within a profession, we can also look at the upper and lower quartiles. The lower and upper quartile means that 25 per cent of wages are lower than the lower quartile, and correspondingly that 25 per cent of wages are higher than the upper quartile. Between these quartiles we find half of all wages.
The table below shows the various statistical targets for five selected occupations. A monthly salary around all these statistical targets is to be regarded as “normal”.
Table 2. Monthly salary. Average, median, lower and upper quartile for selected occupations. NOK
| Average | Median | lower quartile | Upper quartile | |
|---|---|---|---|---|
| 2223 Nurses | 49 440 | 49 030 | 44 230 | 53 240 |
| 2341 Primary school teachers | 48 700 | 49 160 | 45 260 | 52 910 |
| 2611 Lawyer and lawyers | 73 850 | 66 670 | 53 010 | 86 250 |
| 4110 Office staff | 42 540 | 40 400 | 36 510 | 46 590 |
| 5223 Store employees | 35 000 | 35 150 | 29 240 | 38 020 |
The wage level is affected by several factors
Of course, salary is also affected by more than just what profession you have. Factors such as how old you are, how much experience you have, how much you work and of course the level of education, industry and sector all play a role.
Several of these factors we can sort the monthly salary by in the statistics bank.
It will provide a better picture of the wage level that is relevant for some who want to understand more about wages and wage distribution.
Here you will find monthly salary by occupation (total 400), sector and gender.
Here you will find monthly salaries by occupation (total 11), sector and industry.
Here you will find monthly salaries by level of education, sector and industry.
Here you will find monthly salaries by sector, industry and age.
