Results Street finches show: motorized traffic no… (Antwerp)
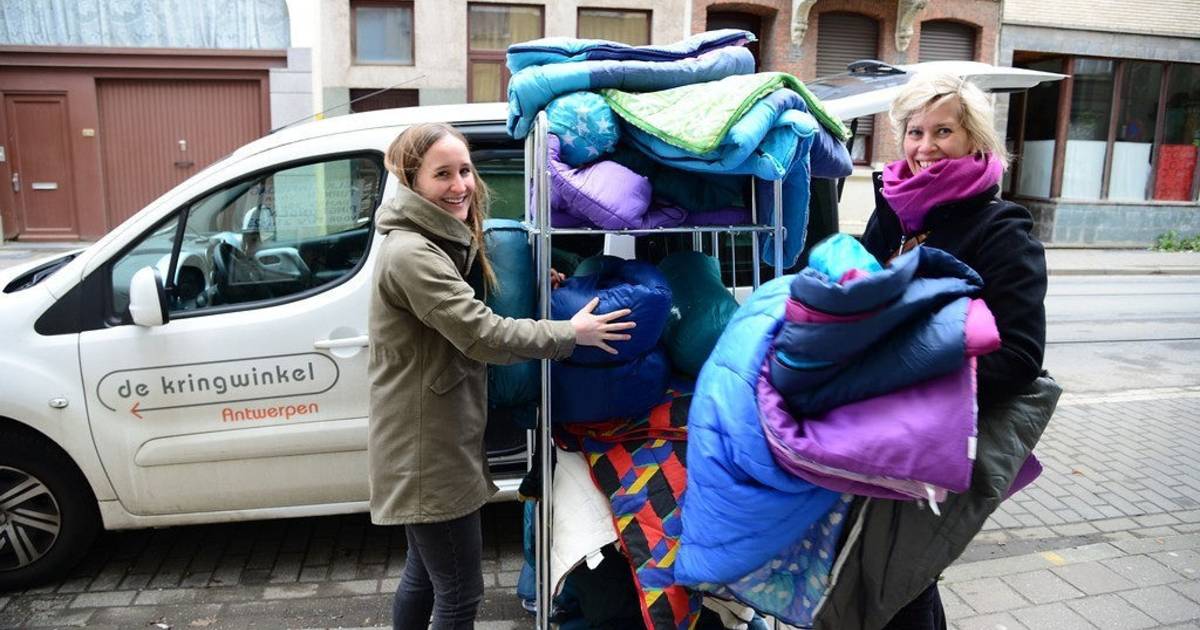
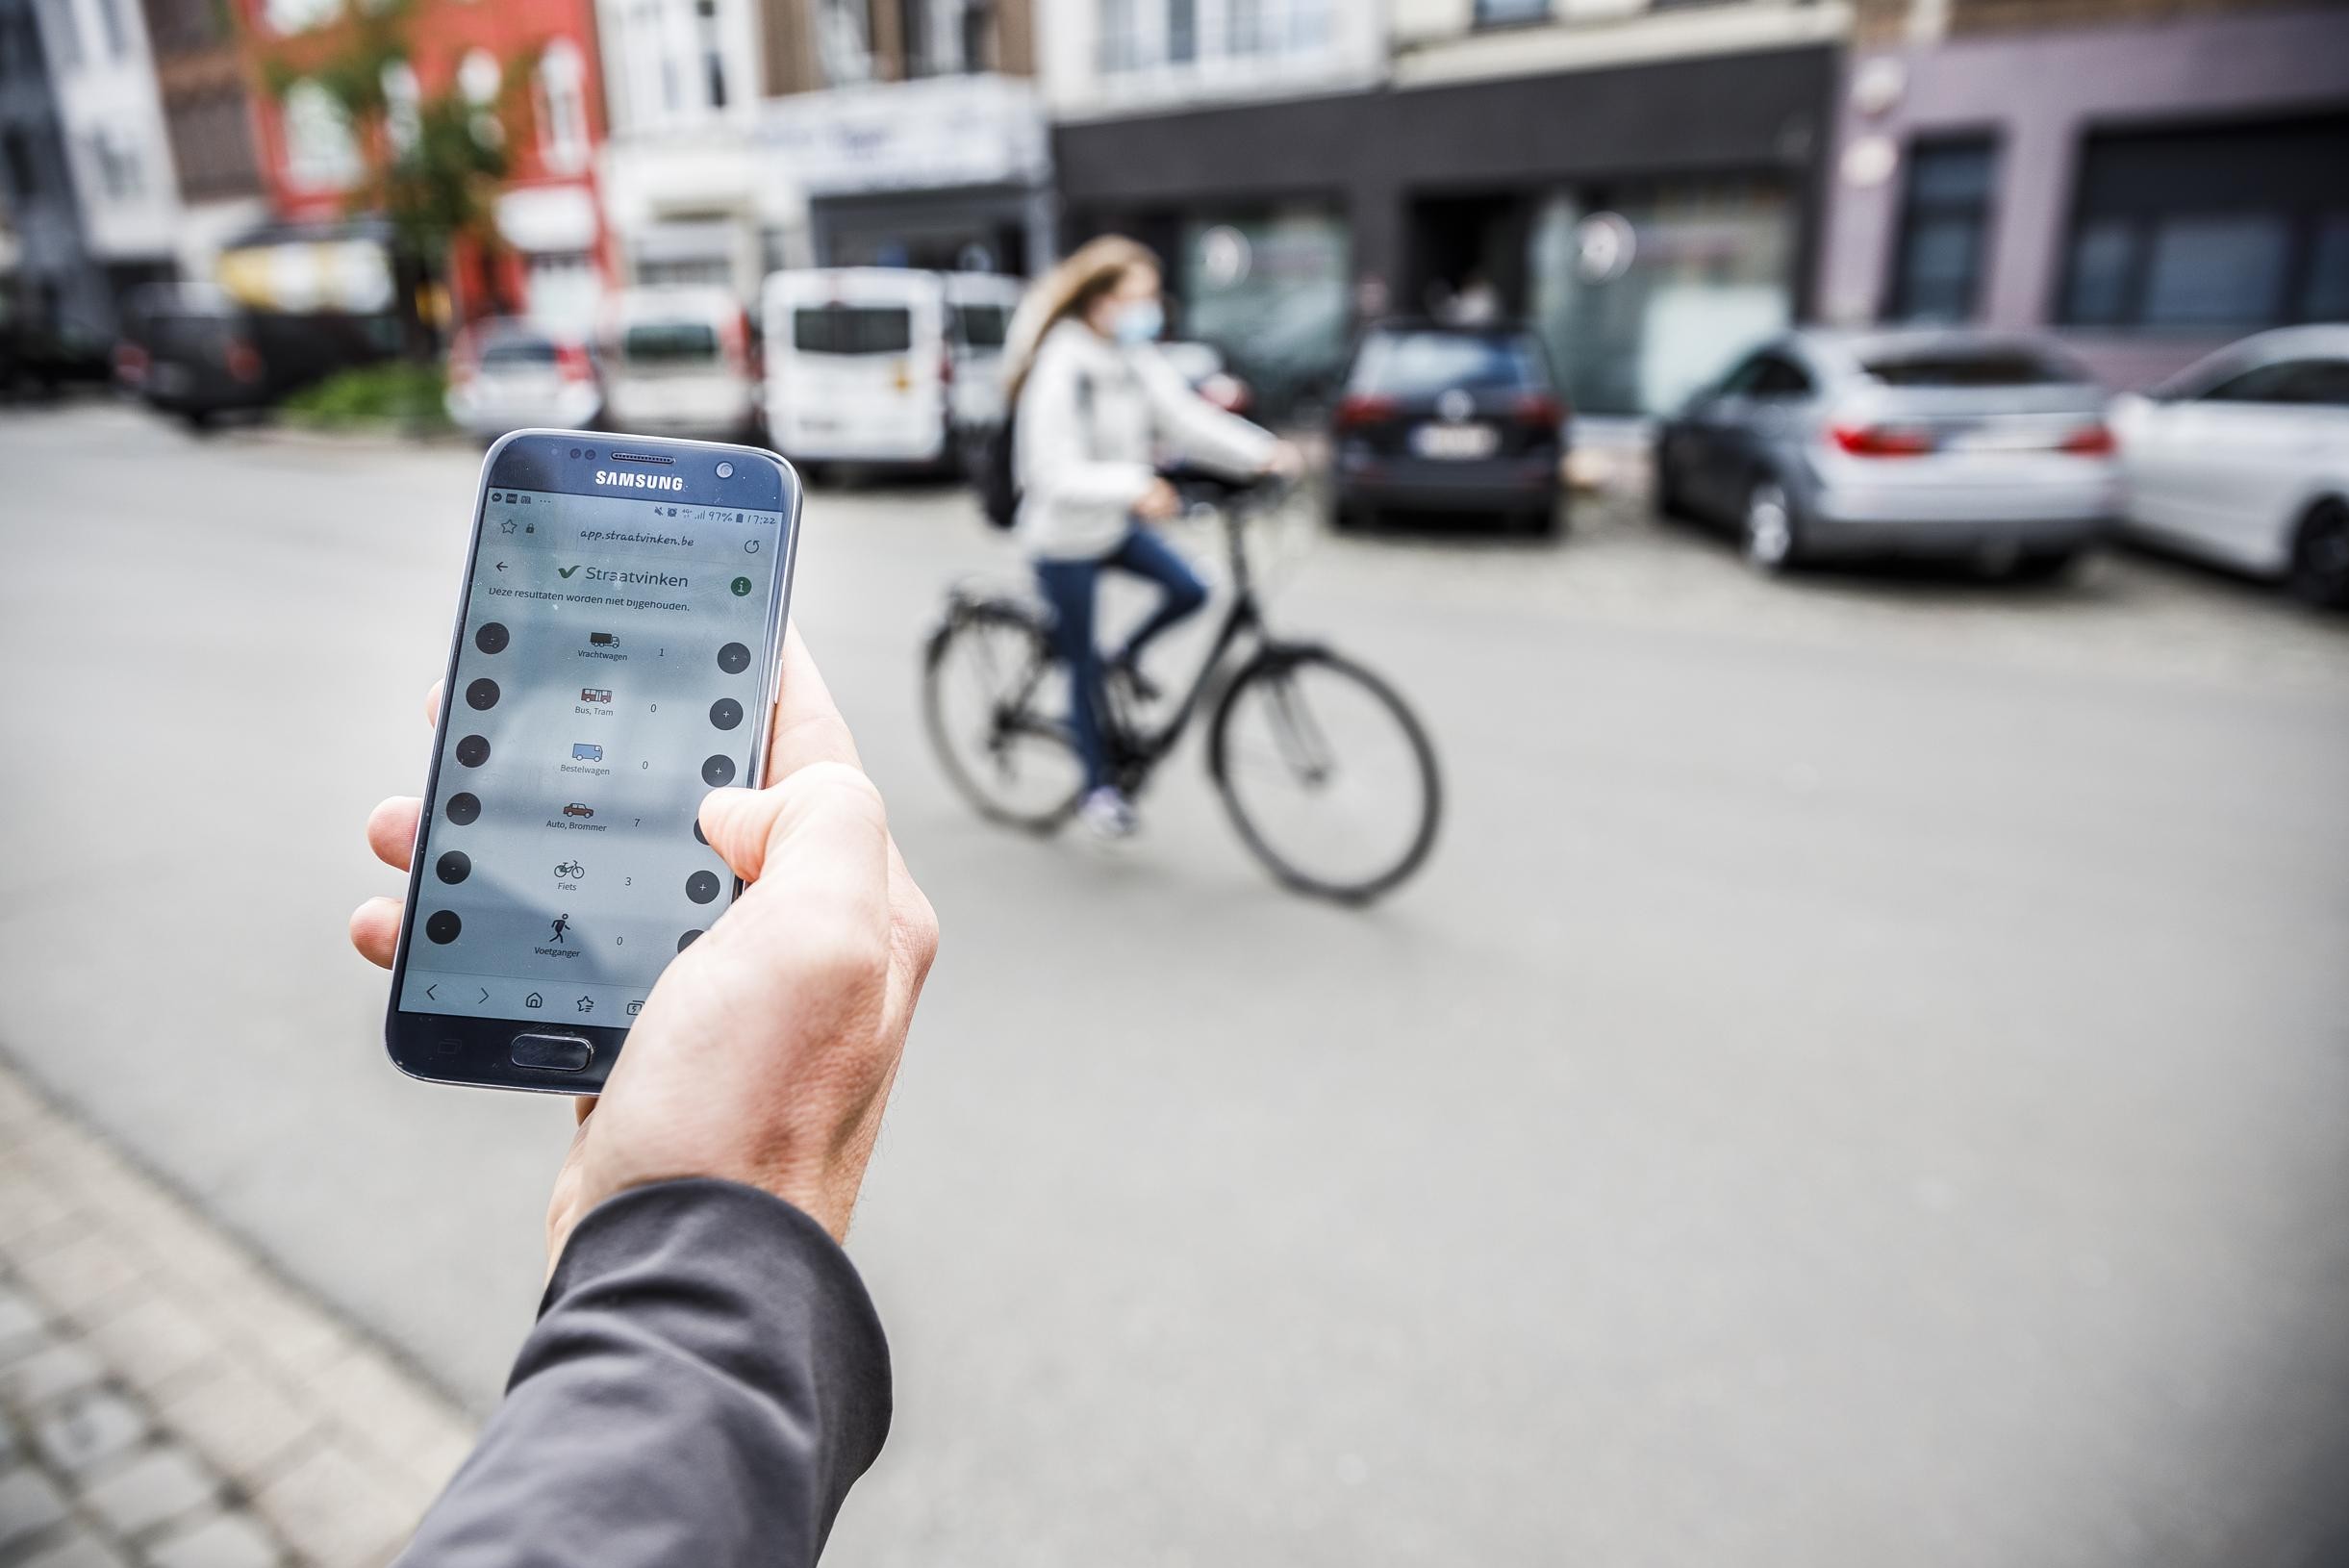
Straatvinken lets hamburgers check off the traffic in their street for an hour every year at the same time in May, in order to map the evolution towards more sustainable mobility. It is an initiative of the Ringland Academy and takes place under scientific supervision of the University of Antwerp and the KU Leuven. The study took place for the fourth time this year and will run until 2030 modal split (traffic composition) at street level “because that is the place where citizens experience the impact of traffic on a daily basis.” In the ‘Future Alliance’, the government has committed itself to a shift from 70% car traffic and 30% sustainable alternatives to a 50/50 ratio by 2030. Straatvinken wants to keep a finger on the pulse in that process. This year, citizens counted in 264 of the three hundred Flemish cities and municipalities. In addition to counting, participants also completed an accompanying livability survey.
© r
More motorized traffic in Antwerp city
After four editions with Straatvinken, this year we can offer a picture of long-term trends in traffic in our cities and municipalities for the first time. But those trends don’t look pretty.
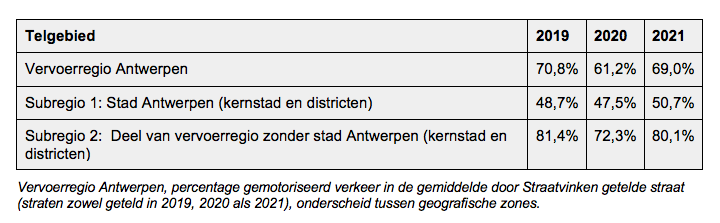
“If we look at the evolution of the share of motorized traffic in all parts of the Antwerp transport region (with 32 municipalities from Essen to Boom, from Beveren to Malle), we see that share fell sharply during the May lockdown edition. 2020 But in May 2021 we were again almost at the level of 2019,” says Thomas Vanoutrive of the Urban Studies Institute of the University of Antwerp. “In September and October, traffic jam records were even broken again.”
There is also a difference in evolution between the city and beyond. In Antwerp and districts, the share of motorized traffic is lower – around 50% – than in the neighborhoods and municipalities further away from the center. This is partly due to the greater availability of public transport in cities and good accessibility of services.
“However, it is important that here too the modal shift perseverance to achieve the objective of the Future Alliance for the entire transport region.” Street finches indicate a reverse evolution. “For the city of Antwerp, we see that despite a temporary kink in 2020, the share of motorized traffic is new growth this year.”
In the other parts of the transport region, this was slightly lower in May compared to 2019. “But insufficient to achieve that 50/50 ratio by 2030. If we now draw the line from 2018 to 2030, then the decrease is much less sharp than anticipated”, Vanoutrive targets. “When drafting the Future Alliance, there was support for more sustainable mobility. But today we see no indication that we are heading in the right direction. In that sense, the results of this edition are a wake-up call.”
© r
A kale trip
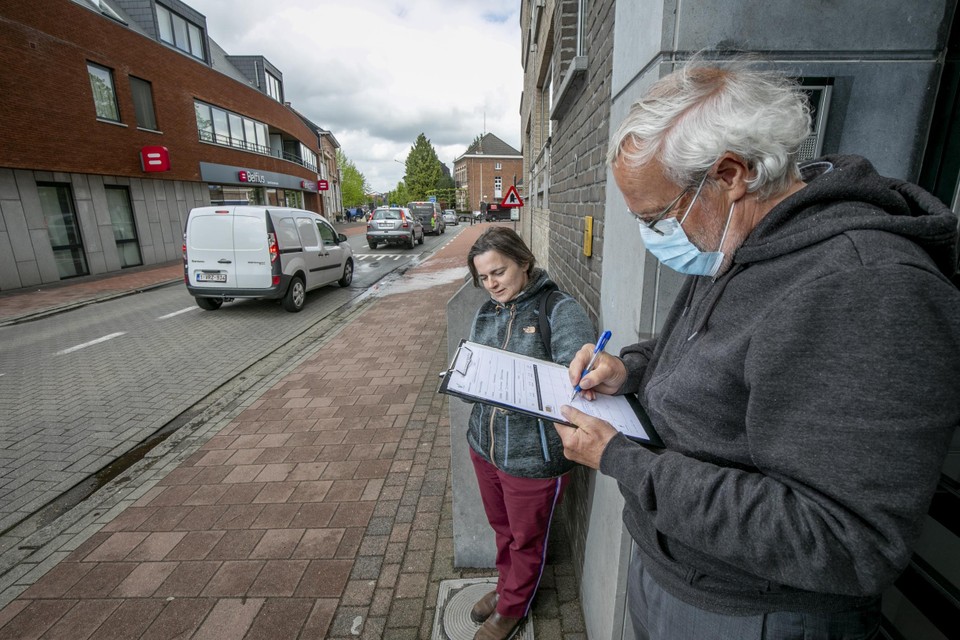
The quality of life survey also shows that there is still a long way to go. The previous count took place in 2020. The streets were fuller and there was more social interaction between neighbors. This was reflected last year in the quality of life barometer and the thousands of stories that citizens shared at the time. But anyone who thought that the unexpected side effect of the lockdown would also lead to a turnaround in our mobility behavior in the short term, comes from a bare-bones journey. This is what Straatvinken says.
“The results from May this year show that it was only a brief rebound. The number of participants in the quality of life survey who expressed negative feelings about their street increased by 30% compared to the lockdown count. The number of participants who advise against coming to live in their street also increased by a similar percentage,” says Professor Huib Huyse of KU Leuven.
“In a sense, the severe lockdown in the spring of 2020 can be viewed as a big on new tires when it comes to traffic avoidance. This research has a significant influence on the perception of the street. traffic returns, the perception of the street becomes more negative and progress for all quality of life indicators is erased again. I think it is sobering for many that the weather business as usual is.”
“With streets dominated by cars, there is little room to improve road safety and traffic congestion, increase space for pedestrians and cyclists, tackle noise pollution and the lack of greenery. These are all indicators that largely determine the quality of life on streets, as our research shows,” says Vanoutrive.
This also exposes the ‘liveability rose’, which enables participants to assess their street using twenty quality of life indicators. The scores for almost all indicators in 2021 will be 5 to 10% lower on average. “However, with a limited number of traffic interventions you can already have a significant impact on quality of life. Our research shows that more needs to be done to make traffic more sustainable at street level. Our commitment and others involved actors still face a major challenge,” said Professor Huyse.
Or the researchers notice that the support from cities and expansions to increase the quality of life modal shift to realize? “In any case, we feel that there is a lot of interest in the results of Straatvinken”, says Huyse. “I do think that many local authorities are still looking for tools to help residents work around this theme. That is not clear. In the redevelopment of streets, more agendas are involved than in the past, such as the climate robustness of streets. With Straatvinken we want to give to get started with that.”
© Joren De Weerdt
All results can be consulted at www.straatvinken.be